Unified Reporting Hub for Biotech Operations
Turning Data Into Decision Ready Intelligence
Biotech Operations
Manufacturing
Operational data was scattered across multiple systems, making reporting slow and unreliable. This project unified critical biotech KPIs into a single, trusted reporting hub that helps leaders move from insight to action without manual data work
Overview
Transforming fragmented biotech data into a trusted, decision-ready reporting experience
My Role
UX Strategist & Lead Designer, responsible for information architecture, wireframes, and data visualization
The Problem
Leaders Were Making Decisions With Fragmented, Outdated Data
Biotech operations were relying on manual data pulls from 5+ systems (LIMS, ERP, QC, etc.). Every reporting cycle required stitching data together by hand, debating metric definitions, and chasing missing context. By the time reports reached leadership, the information was already outdated
- Slow, stale data
- Inconsistent KPIs
- No context
- High operational cost
What I Did
I focused on unifying KPIs, eliminating friction, and building a structure that guides leaders from “status” to “action” with zero ambiguity
KPI Alignment & Definition
- Worked with operations, manufacturing, QC, and leadership to align on a single definition per KPI
- Removed conflicting or vanity metrics that added noise
- Established clear ownership and purpose for each metric
- Ensured KPIs reflected real operational health, not just system outputs
Information Architecture Design
- Designed a 3 tier IA model: Executive Overview → Department Context → Root-Cause Detail
- Defined consistent drill down paths so users always know where they are
- Reduced navigation complexity by standardizing how data is explored across domains
Executive Level Dashboard Design
- Curated a small set of mission critical KPIs for the top level view
- Used large number cards, gauges, and status thresholds for instant scanning
- Ensured the dashboard answers “Is something wrong?” in seconds
Contextual Drill Down & Analysis
- Designed contextual views for Manufacturing, QC, and Supply Chain
- Introduced 90 day trend views to show direction, not just snapshots
- Added benchmarking visuals to quickly highlight deviations between lines or teams
- Prevented dead ends by ensuring every insight leads somewhere actionable
Root Cause & Evidence Layer
- Created a consistent pattern from charts → filtered tables → export-ready data
- Reduced reliance on analysts by making raw data accessible when needed
- Ensured every metric could be traced back to its source system
- Maintained audit ready outputs to support regulatory and operational reviews
The Solution
A centralized reporting platform built around a simple principle:
Show only what matters at the top, and reveal more only as the user digs deeper
Executive Summary Dashboard
- Top 5 mission-critical KPIs only
- Gauge charts + big number cards for instant scanning
- R/Y/G thresholds to make problem areas jump out immediately
Departmental Drill-Down
- Each KPI opens a contextual view: Manufacturing, QC, Supply Chain, etc
- Trend charts covering the last 90 days
- Benchmarking visuals comparing teams/lines to spot deviations faster
Root Cause & Raw Data
- A consistent drill-down pattern that takes users from graphs → filtered tables → export-ready data
- This replaced long back and forth cycles with analysts
Biotech-Specific Data Widgets
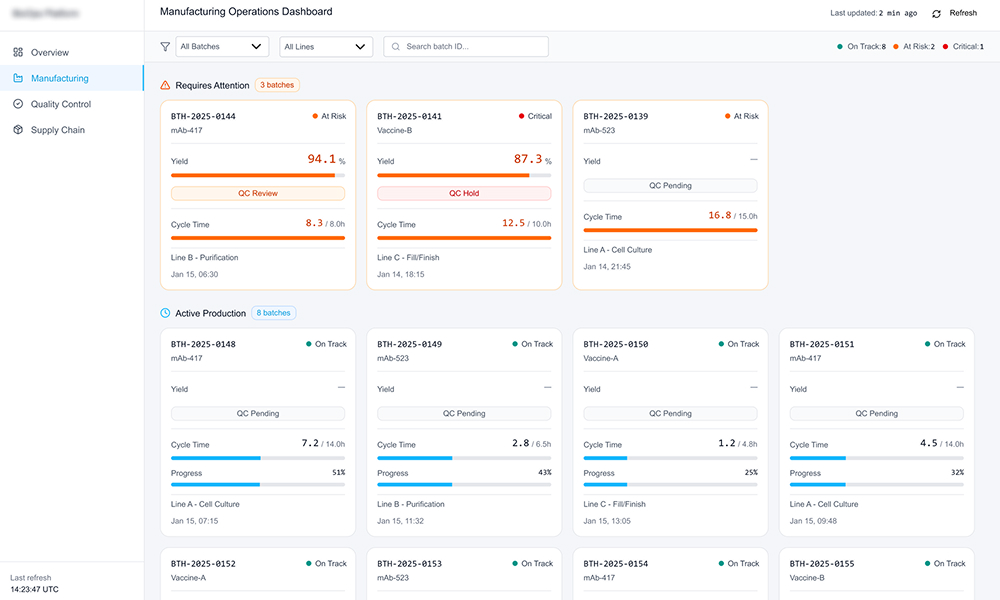
- “Batch Status Card” combining yield, QC flags, and cycle time into one tight visual
- Reduced screen clutter and made complex data feel digestible
Root Cause & Raw Data
A fast, high-level view of operational health. Only the KPIs leadership needs to know where to look
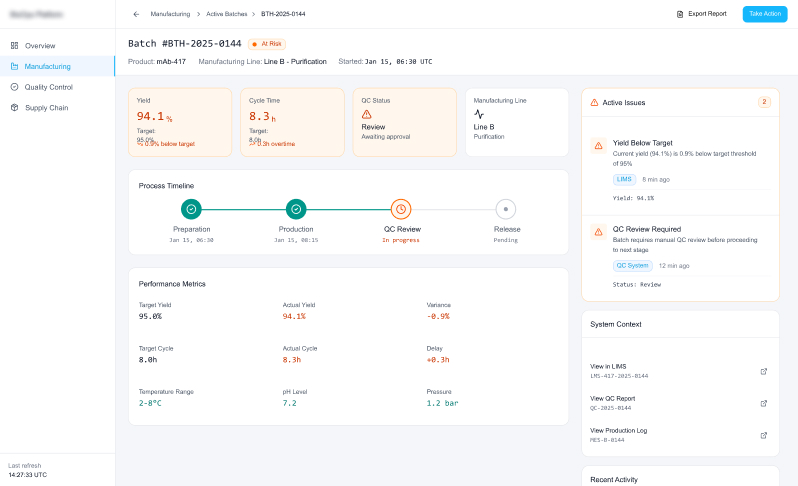
Context
Once an issue appears, the system immediately adds operational context. No chasing data across manufacturing, QC, or supply chain tools
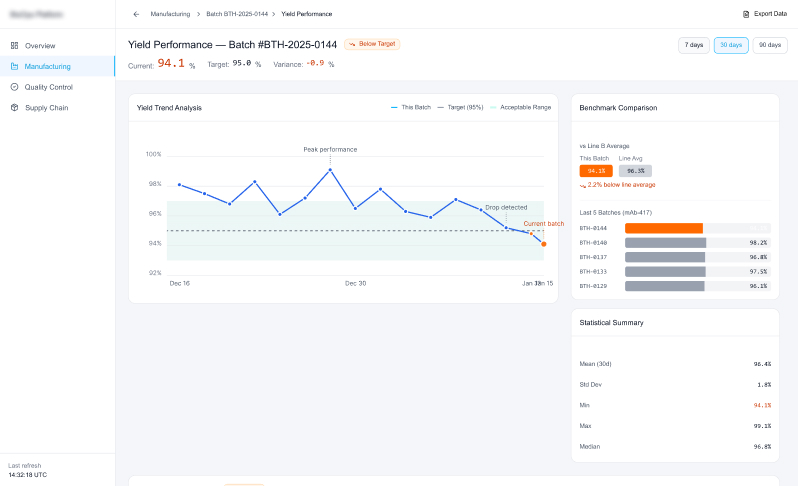
Insight
Patterns over time, benchmarks, and comparisons surface the why, not just the what. Leaders can spot deviations before they become problems
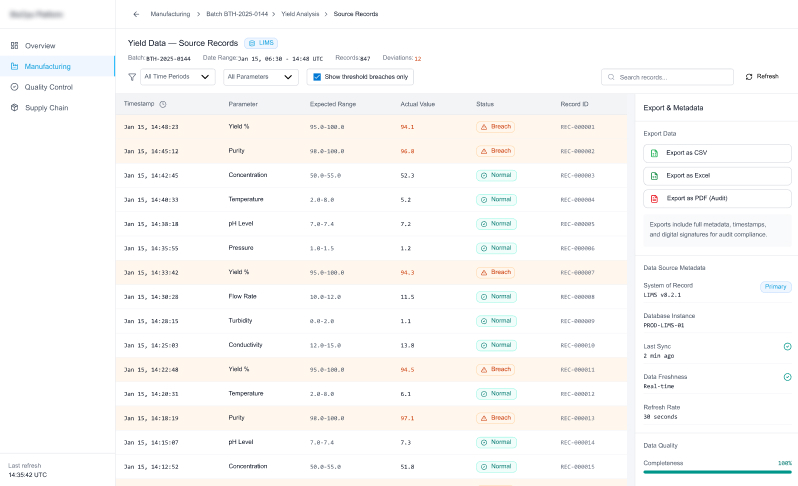
Evidence
Every insight traces back to audit-ready, exportable data. No debate, no manual follow-ups, full confidence in decisions
Impact & Results
Faster Decisions, Less Manual Work, A Trusted Single Source of Truth
| Metric | Before | After | Change |
|---|---|---|---|
| Decision Cycle Time | 48 hours | 12 hours | 75% Faster |
| Report Generation Time | 16 hours | 1 hour | 94% Faster |
| Analyst Time Reallocated | N/A | ~2 Days/Week | Redeployed to meaningful analysis |
| Executive Data Confidence | Low–Medium | High | Trust restored |
Cutting the decision cycle from two days to half a day changed how quickly teams could react to manufacturing and R&D bottlenecks. It had a real impact on operational efficiency and profitability
Got a similar problem?
Let’s talk